Needham Aggressive Growth Fund – 3Q26

Download PDF

Market Review & Macro Observations

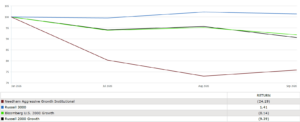
  • In 3Q26, the Russell 2000 Growth and Russell 3000 returned -9.39%, and 1.41%, respectively. The
    small-cap Information Technology sector significantly underperformed, after a very strong 1H26.
  • Entering 3Q26, we had hoped that the U.S.-Iran Memorandum of Understanding could stabilize the oil
    market and lead to broader peace in the Middle East. However, the ceasefire collapsed in early July.
  • Inflation remains above the Federal Reserve’s 2.0% target. The Fed’s preferred inflation measure is
    the Core PCE (Personal Consumption Expenditures), which excludes food and energy because they
    are seen as volatile. Year-over-year core PCE inflation held at 3.0% in July and August and
    accelerated to 3.1% in September.[1]
  • The Bureau of Labor Statistics reported unemployment rates of 4.2% in June, 4.1% in July and 4.1% in
    August, consistent with the level of the last 18 months.[2]
  • Real GDP grew at a 2.2% annual rate in 2Q26, revised up from 1.5% in both the advance and second
    estimates.[3] The Atlanta Fed’s GDPNow model pointed to even stronger growth for 3Q26: its estimate
    reached 5.1% in mid-September before ending the month at a solid 3.7%. Growth near 5%, if
    sustained, would ease many macroeconomic pressures.[4]
  • At its September 2026 meeting, the Fed Open Market Committee raised interest rates to 3.75 –
    4.00%, The updated Federal Reserve “dot plot” of future expectations shows one more 25bps
    increase by the end of 2026.
  • 10-year interest rates rose to 5.3% from 4.4% at the beginning of the quarter. 5.3% was the highest
    since May 2002.[5] Small caps are often under pressure when rates rise. We believe that 5% is a very
    normal interest rate compared to the very low and zero-interest rate policies of recent years.
  • In July and August, semiconductor and AI-related stocks fell. In July, The Wall Street Journal reported
    that NVIDIA was in talks to guarantee $250B of financing for OpenAI to lease a $500 billion data
    center project in southern Ohio, igniting concern over circular financing and debt funding of data
    centers and neoclouds.[6] These stocks rebounded in September.
  • The large, leveraged AI hedge fund, Situational Awareness LP, blew up in late July. It had almost no
    direct overlap with our portfolio’s holdings. However, its collapse pressured any stocks related to AI.


Portfolio Performance

  • Our mission is to create wealth for long-term investors. The Fund’s investment strategy is to find
    companies when they are Hidden Compounders and hold them until they become Quality
    Compounders.[7]
  • In 3Q26, the Fund’s Institutional (NEAIX) and Retail (NEAGX) classes returned -24.19% and -24.27%
    respectively. The same holdings that outperformed in 1H26 significantly underperformed in 3Q26.
    Most of the companies suffered from multiple compression as their businesses produced strong
    results.
  • The Fund’s top contributors for 3Q26:
    • Super Micro Computer, Inc. (SMCI), which reported $60 billion in new orders during the quarter
      ending June 30, and $39 billion of revenue for the fiscal year ending June 30, 2026. Importantly,
      Super Micro also reported high double-digit gross margins, well above the last few quarters.
    • 908 Devices, Inc. (MASS) makes handheld chemical analysis devices used in public health, safety,
      and defense. Its devices identify trace levels of opioids, explosives, chemical agents, and other
      unknown substances.
    • CRA International, Inc. (CRAI) provides consulting services to law firms, corporations, accounting
      firms, and governments around the world. Legal and regulatory work is a significant portion of its
      revenue. CRA International, Inc. was a detractor in 1H26 on fears of AI disruption and rebounded in
      3Q26.
  • The Fund’s top detractors for 3Q26:
    • Arteris, Inc. (AIP) is a leading supplier of network-on-chip (NoC) interconnect IP, which manages
      data flow between the processors, memory, and other functional blocks on a system-on-chip
      (SoC). It reported strong bookings, revenue and earnings in the quarter and raised guidance.
    • nLight, Inc. (LASR), makes high-power lasers and laser systems for defense and industrial
      markets. nLight reported strong 2Q results, but guided 3Q lower as China’s increased scrutiny of
      dual-use exports delayed deliveries of optics and other commodity materials, pushing roughly $17
      million of expected 3Q product shipments into later quarters. Management said the affected parts
      are not complex, and it is working on other sources.
    • Vishay Intertechnology, Inc. (VSH) makes passive components and semiconductors used across
      industrial, automotive, computing, and other end markets. The Fund first invested in 2024, as CEO
      Joel Smejkal rolled out Vishay 3.0[9], a growth strategy built around expanding capacity to serve
      high-growth markets. 2Q26 results showed strong revenue, earnings, and guidance, bolstered by a
      1.32 book-to-bill ratio.

Portfolio Changes

  • With 6% trailing 12-month turnover, the Fund does not rotate into or out of sectors but invests in
    companies we believe may outperform over the long term.
  • The Fund ended the quarter with a 3.4% cash position. New investments included AeroVironment, Inc.
    (AVAV), SCHMID Group N.V. (SHMD), and Wix.com Ltd. (WIX).
  • Among the largest additions to established positions were nLight, Inc. (LASR), TETRA Technologies,
    Inc. (TTI), Twin Disc, Inc. (TWIN), and Vishay Intertechnology, Inc. (VSH).
  • Among the positions exited were Blackline Safety (formerly BLN-CA) upon its acquisition by Francisco
    Partners, Red Cat Holdings Inc. (RCAT), and Transcat, Inc (TRNS).
  • Among the largest sales of positions still in the Fund were Bruker Corp. (BRKR) and Vital Farms, Inc.
    (VITL).

Investment Opportunities

  • Our major investment theme remains the importance of U.S. infrastructure – the lesser-known “pick
    and shovel” providers. Our portfolio companies sell into data centers, life sciences labs,
    semiconductor and other manufacturing plants, roads, airports, power plants, and more. Despite the
    current uncertainty, the U.S. has underinvested in these areas, so there may be long tailwinds. We
    continue to believe there may be compelling valuations in our small cap “picks and shovels” universe.
  • Five areas present throughout our investments:
    1. Semiconductor manufacturing
    2. Data Centers/AI processing
    3. U.S. Manufacturing
    4. Defense technology
    5. Public safety

[1] https://www.bea.gov/sites/default/files/2026-10/pi0926.pdf

[2] https://www.bls.gov/charts/employment-situation/civilian-unemployment-rate.htm

[3] https://bea.gov/news/2026/gdp-third-estimate-industries-corporate-profits-state-gdp-and-state-personal-income-2nd

[4] https://www.atlantafed.org/research-and-data/data/gdpnow/current-and-past-gdpnow-commentaries

[5] https://www.cnbc.com/quotes/US10Y

[6] https://www.wsj.com/tech/ai/nvidia-in-talks-with-openai-to-guarantee-250-billion-financing-for-data-center-3dd6eae3

[7] https://www.needhamfunds.com/growth-factor/maintaining-conviction-during-volatile-markets/

[8] https://investors.nlight.net/news-releases/news-details/2026/nLIGHT-Awarded-627-Million-Joint-Laser-Weapon-System-JLWS-Contract/default.aspx

[9] https://ir.vishay.com/news-releases/news-release-details/vishay-intertechnology-implements-restructuring-actions


Definitions and Disclosures

The information presented in this commentary is not intended as personalized investment advice and does not constitute a recommendation to buy or sell a particular security or other investments. This message is not an offer of the Needham Growth Fund, the Needham Aggressive Growth Fund, or the Needham Small Cap Growth Fund (each a “Fund” and collectively, “the Funds”). Shares are sold only through the currently effective prospectus. Please read the prospectus carefully and consider the investment objectives, risks, and charges and expenses of the Fund carefully before you invest. The prospectus contains this and other information about the Fund.

All three of the Needham Funds have substantial exposure to small and micro-capitalized companies. Funds holding smaller-capitalized companies are subject to greater price fluctuation than those of larger companies. Needham Aggressive Growth Fund’s ownership as a percentage of net assets in the stated securities as of September 30, 2026: SMCI: 2.71%; MASS: 0.96%; CRAI: 1.80%; AIP: 3.84%; LASR: 3.49%; VSH: 4.08%; AVAV: 0.19%; SHMD: 0.27%; WIX: 0.18%; TTI: 1.69%; TWIN: 0.60%; BLN-CA: 0.00%; RCAT: 0.00%; TRNS: 0.00%; BRKR: 0.93%; VITL: 0.48%.

The Global Industry Classification Standard (GICS®) was developed by and/or is the exclusive property of MSCI, Inc. and Standard & Poor’s Financial Services LLC (“S&P”). GICS is a service mark of MSCI and S&P and has been licensed for use by U.S. Bancorp FundServices, LLC.

The Russell 3000® Index measures the performance of the largest 3,000 U.S. companies representing approximately 96% of the investable U.S. equity market, as of the most recent reconstitution. The Russell 3000 Index is constructed to provide a comprehensive, unbiased and stable barometer of the broad market and is completely reconstituted annually to ensure new and growing equities are included. The Russell 2000 Growth Index includes those Russell 2000 Index companies with higher price-to-value ratios and higher forecasted growth values. An investor cannot invest directly in an index. Needham & Company, LLC is a wholly owned subsidiary of The Needham Group, Inc. Needham & Company, LLC, member FINRA/SIPC, is the distributor of The Needham Funds, Inc.

The source of the data for each of the Russell 2000 Growth Index and the Russell 3000 Index (together, the “Indexes”) is the London Stock Exchange Group plc and its group undertakings (collectively, the “LSE Group”). © LSE Group 2026. All rights in the Indexes vest in the relevant LSE Group company which owns the Index. The Indexes are calculated by or on behalf of FTSE International Limited or its affiliate, agent or partner. Neither the LSE Group nor its licensors accept any liability for any errors or omissions in the Indexes; no party may rely on the Index returns shown; and the LSE Group makes no claim, prediction, warranty or representation about the Fund or the suitability of the Indexes with respect to the Fund. No further distribution of data from the LSE Group is permitted without the relevant LSE Group company’s express written consent. The LSE Group is not connected to the Fund and does not promote, sponsor or endorse the Fund or the content of this prospectus.