
Market Review & Macro Observations
- Despite near-term macro volatility, structural tailwinds such as AI infrastructure investment, power generation, automation, military modernization, and digital infrastructure, continue to create opportunities across sectors.
- Hard assets that support AI growth have outperformed software equities, which have greater exposure to AI’s potential downside risks.
- Technology sector capital spend continues to drive significant economic activity, broadening revenue opportunities across supply chains.
- The Treasury yield curve has steepened and remains healthy for capital markets, though geopolitical risks may cause inflation to remain elevated.
- Continued merger and acquisition activity signals economic confidence, as these deals can reflect investments in future growth.
Portfolio Performance
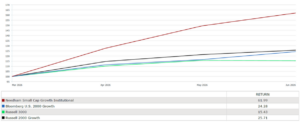
- The Fund’s Institutional (NESIX) and Retail classes (NESGX) returned 61.99% and 61.77% respectively in the second quarter, compared to the Russell 2000 Growth’s 25.71% and the Russell 3000’s 15.44%.
- We believe there is significant value within the small-cap asset class, and investor interest in small caps has accelerated so far in 2026. Management teams continue to focus on improving cost structures and margins, accelerating revenue, expansionary planning and strengthening balance sheets.
- The Fund ended the quarter with a 14.1% cash position following a significant market recovery throughout the quarter.
- The Fund’s top five performers in 2Q26 were: Arteris, Inc. (AIP), Vishay Intertechnology, Inc. (VSH), Veeco Instruments, Inc. (VECO), CEVA, Inc. (CEVA) and PDF Solutions, Inc. (PDFS).
- The Fund’s top five detractors on 2Q26 were: Lantronix, Inc. (LTRX), CoStar Group, Inc. (CSGP), Bentley Systems, Inc. (BSY), Red Cat Holdings, Inc. (RCAT) and Primoris Services Corp. (PRIM).
Outlook
- With the U.S. administration’s redirection of economic and social policies, we expect economic activity to remain healthy through the remainder of 2026. Management teams have gained greater certainty about how regulatory, tariff and tax policies will impact their businesses.
- A notable development is the higher long-term Treasury rates, which are the result of inflation risk and bond sales by foreign holders. The duration of the Iran conflict and its ultimate impact on global inflation may shape future Federal Reserve policy.
- Mid-term elections in November will heighten headline risk out of Washington, D.C. as specific issues may create uncertainty in future government policies.
- Control of global trade routes remains central to geopolitical and economic dynamics. Geopolitical developments in the Middle East and Asia reinforce the need for secure trade networks, which increasingly intersect with supply chain security and national industrial strategy.
- Technology remains a long-term strength of the economy, and several major secular trends persist firmly in place to support continued growth. Areas of long-term investment that we continue to like are data centers, semiconductors and capital equipment, communications infrastructure, defense, and specialty material manufacturers. Ongoing innovation within our portfolio companies should benefit the Fund over the long term.
- Despite recent narratives suggesting turbulence in the technology sector, our direct conversations with management teams tell a different story. Across more than 100 company visits in recent months, one message stands out: demand remains strong. Many companies are operating at or near sold-out capacity and are actively expanding. This signals a healthy capital expenditure cycle and a foundation for momentum. What may appear as “cooling” from a distance could be strength and disciplined expansion when viewed up close.
AIP: 8.71%; VSH: 5.04%; VECO: 2.62%; CEVA: 2.36%; PDFS: 2.36%; LTRX: 1.05%; CSGP: 0.18%; BSY: 1.04%; RCAT: 0.82%; PRIM: 1.18%.